interface and application programming
fab academy week 15
For this task, I want to make a dashboard to monitor the efficiency of low tech appliances and use the collected data to improve it. As I already tested P5JS (personal tests and also for one of the fab challenges), I want here to make a dashboard using Node Red.
tests with p5js
Below are some examples of tests I did with p5js with user interaction either moving the mouse or clicking. I have been using the YouTube channel "The Coding Train" for this and it has been very helpful. A few people from the class were interested in this and we sometimes discuss it or share experiments in a dedicated whatsapp group that Jeremy created.node-RED programming
Node Red is an open source program that enables to make Graphic User Interfaces and that can be connected to external input or outputs. I want to display information collected by a temperature sensor connected to my ESP32.installing Node-RED
I followed the manual on Node-RED website on how to get started: here. I went with the option of running it locally on my laptop.
The first thing to do is to install a version of Node.js. This was quite easy, after that you need to use the command line interface to install Node-RED locally.
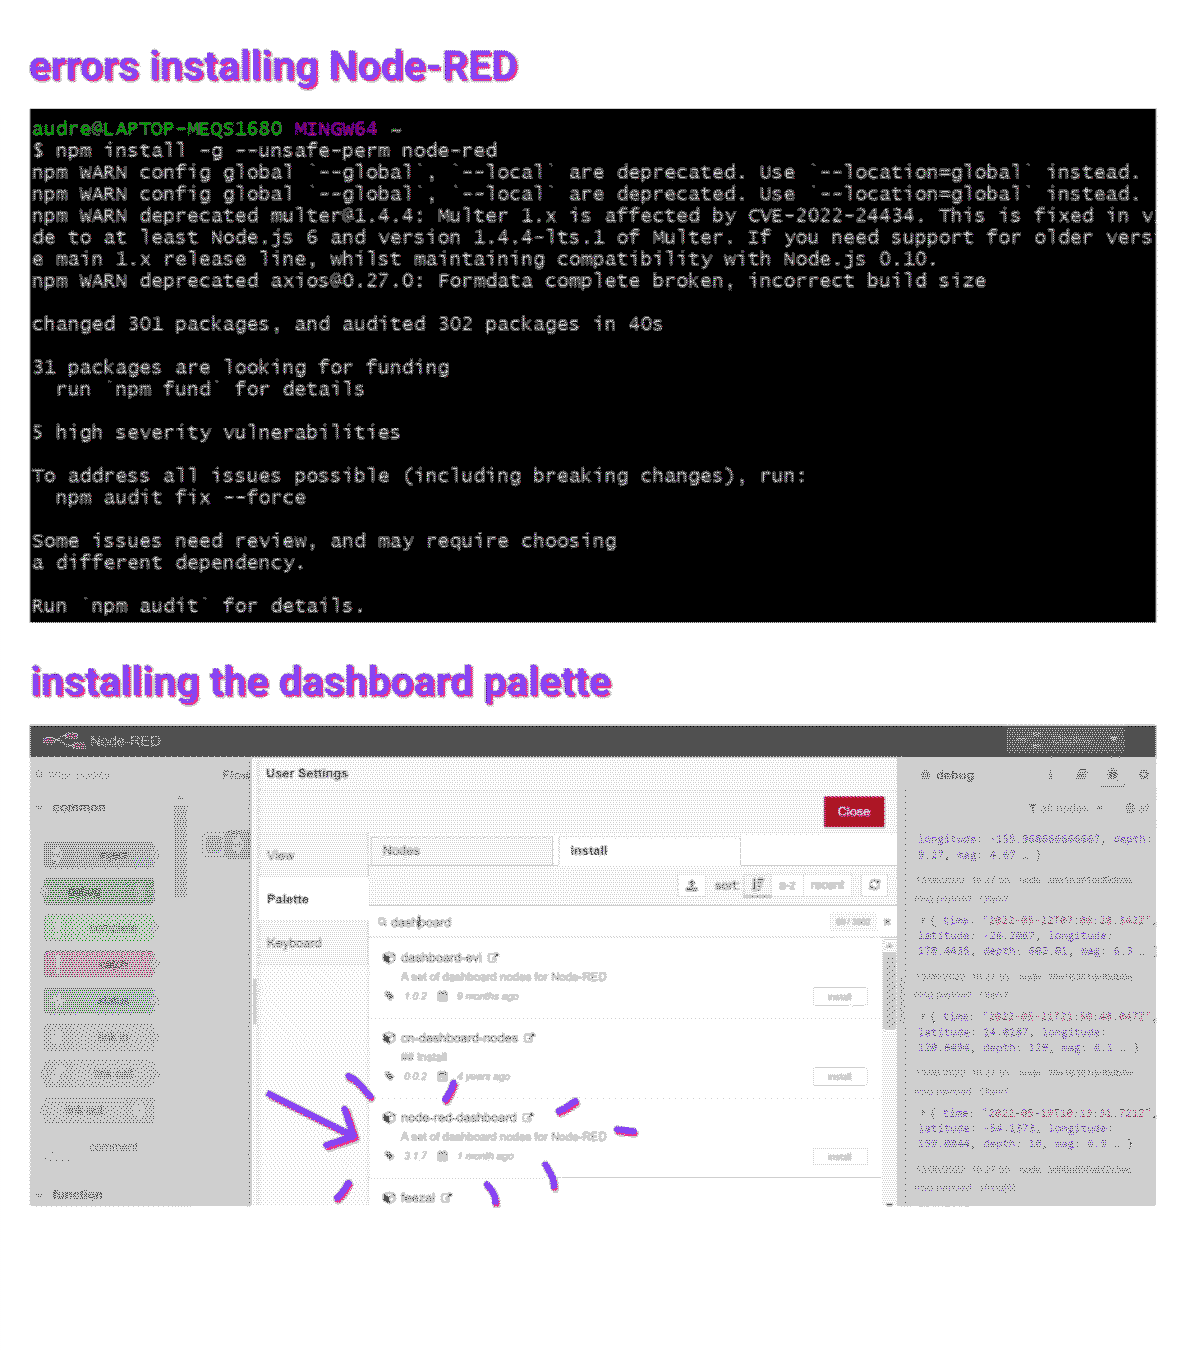
This is when I started having the first issues and warnings (see screenshot on the right), after checking out some forums (like this one) and changing some of node.js files it finally seemed to work.
When this is done, you can start Node-RED by typing "$ node-red" in the command line. When you see something like "[info] Server now running at http://127.0.0.1:1880/" this is a good sign! You can copy the address of the server in your browser and start using Node-RED.
learning how to use it
I followed Node-RED tutorials to learn the basics on how to use it, connect nodes and display information in the debug monitor.
Tutorial 1 : Creating your first flow
Tutorial 2 : Creating your second flow
making dashboards
Dashboard nodes are not in Node-RED by default so I needed to install a "Dashboard palette". I followed this video tutorial to do it and learn how to make a first dashboard: Node-Red Dashboard Tutorial
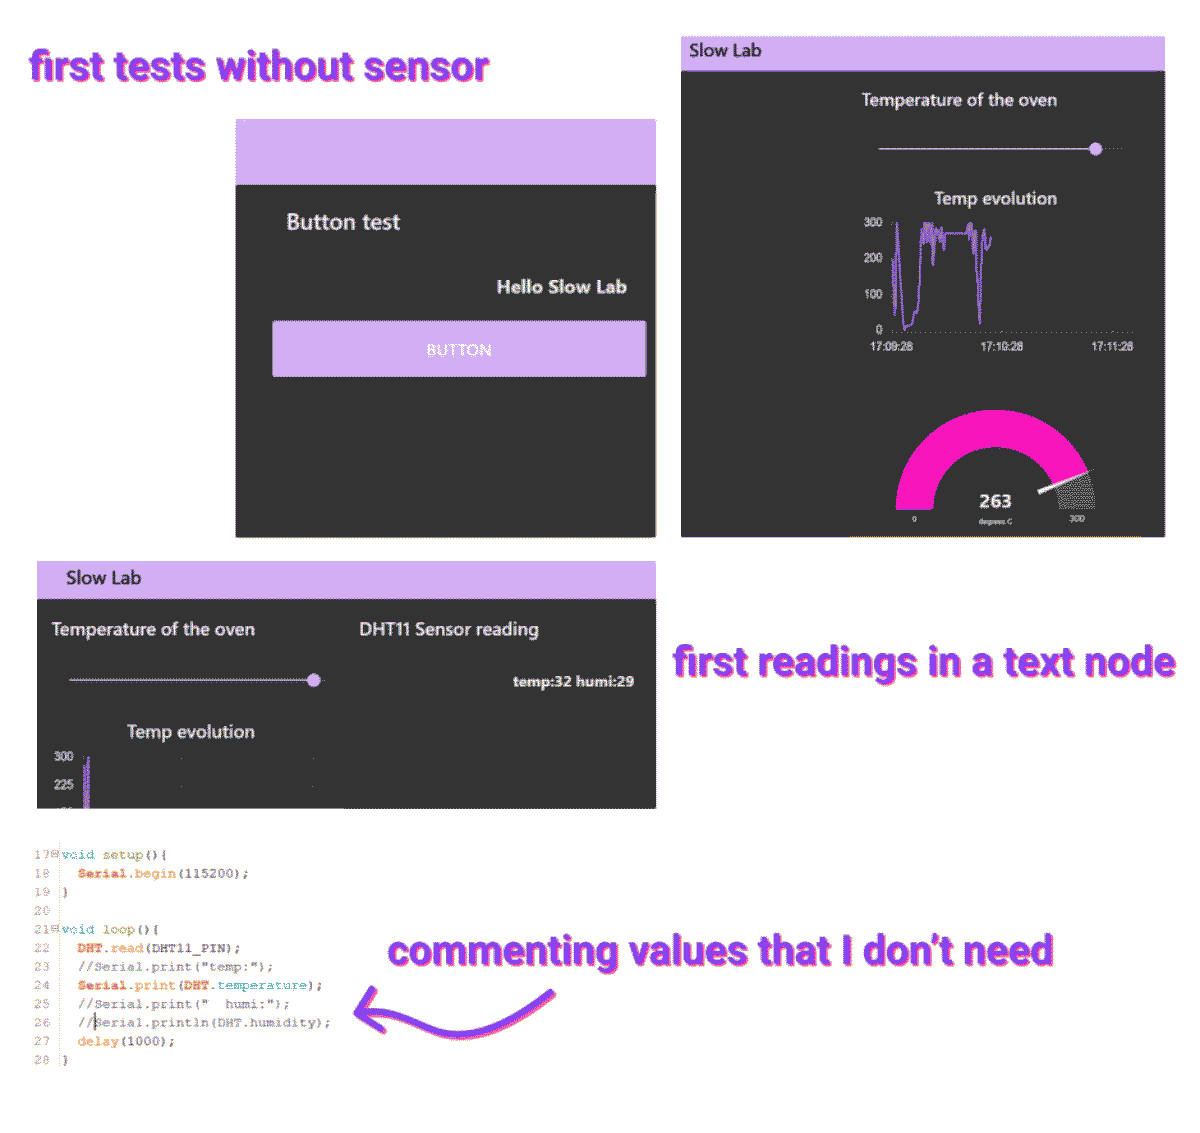
I could custom the screen of the output and try different dashboard elements: text blocks, sliders, charts, gauges...
connecting the dashboard to my ESP32 microcontroller Before exploring more how to do this wireless, I first wanted to test it without sending the data to a “cloud” like Digital Ocean or to a Raspberry Pi so I found a tutorial to to it via a serial port so it will be my first step. Tutorial "Using Arduino with Node-RED to create a Simple Web Dashboard"
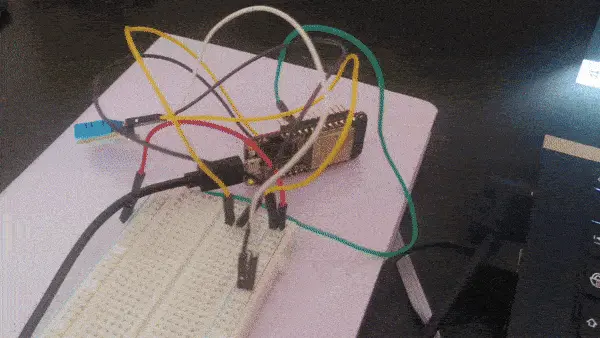
- I first did a simple wiring of the DHT11 sensor that I have to my ESP32 microcontroller
- I installed nodes for serial connection
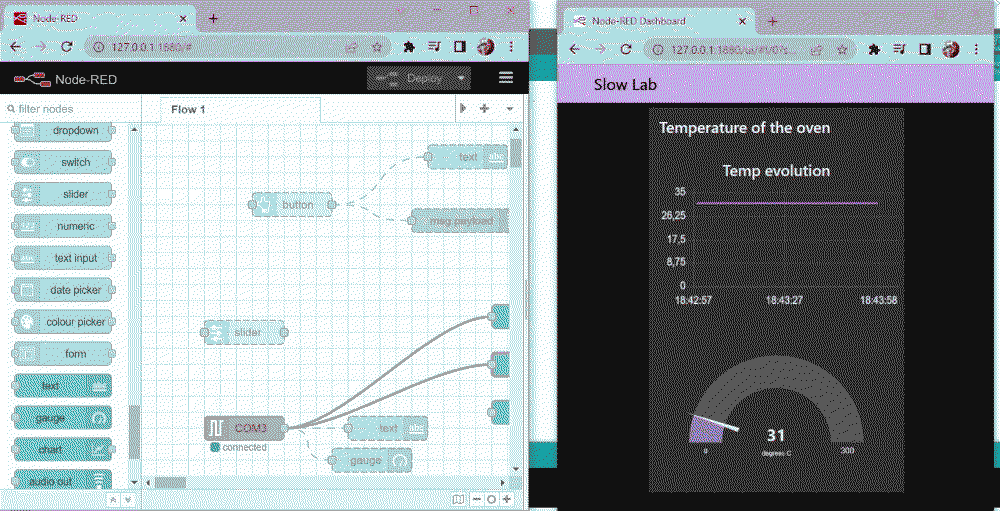
- I added the node “Serial In” and connect it to the port in which the ESP32 is connected.
- This enabled me to first display the values collected in a text node, the problem is that there were 4 values: 2 labels and 2 variables (temperature and humidity) so when I connected the serial input node to the gauge or chart ouput nothing was displayed. To solve this, I commented the values I didn’t need in the Arduino IDE code to only send the value of the temperature. I am sure there is another way but it was a quick fix and I managed to display temperature value on a gauge and its variation in time on a chart.
conclusion
Using Node-RED was very easy and intuitive, the most complicated so far was to install it at the beginning. It makes much more sense to me to use a tool like this rather than p5js for the kind of dashboards I want to make.I see p5 more for artistic creations but maybe it is because I haven't explored it enought yet.
Now the next step would be to be able to save this data and make the system wireless. I will need to investigate on the MQTT protocol for this and see if I need other hardware to make it work.
tools I worked with
p5jSNode-RED
Arduino IDE
ESP32 and DHT11 sensor